
Chart Smarter, Trade Better: Essential Market Insights
At Profitoclock, we aim to provide you with the knowledge and tools to make confident and informed trading decisions. Today, let’s explore some basic technical analysis concepts to enhance your skills and complement the insights provided by the Profitoclock indicator.
Profitoclock
1/18/20251 min read
1. Buy/Sell Signals
The Profitoclock indicator simplifies trading by providing clear buy or sell signals based on market trends. These signals are derived from advanced algorithms and help traders identify optimal entry and exit points. By following these signals, you can align your trades with prevailing market momentum.
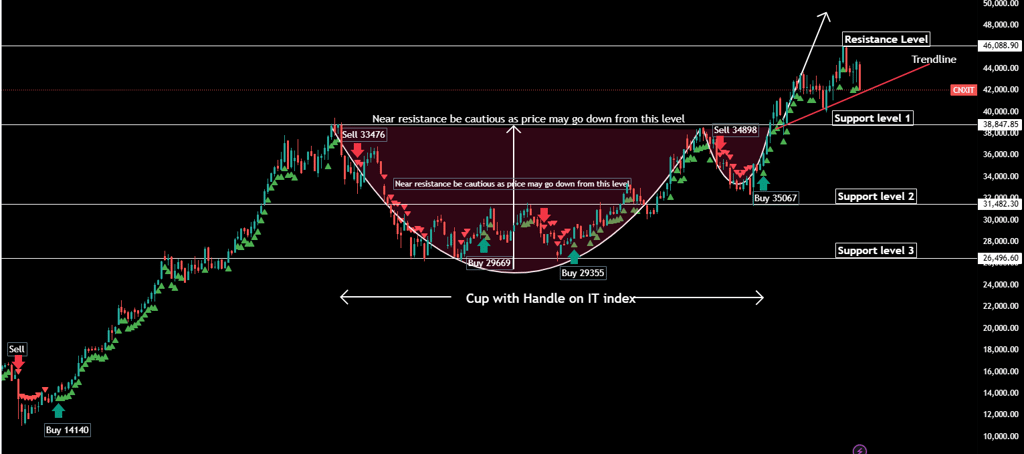
2. Support and Resistance
Support and resistance are critical concepts in understanding price movements:
Support refers to a price level where buying interest is strong enough to prevent further decline.Resistance is a price level where selling pressure is significant, halting upward movement.
Key Insight: When the price breaks through a resistance level, that level often transforms into a new support as the market retraces. This behavior occurs because buyers see the former resistance as an opportunity to re-enter the market.
3. Booking Profits Near Resistance
Approaching resistance levels calls for strategic decision-making:
Be cautious of potential reversals.
Consider booking profits to secure gains, as resistance often acts as a psychological barrier, causing price pullbacks toward the nearest support.
4. The Role of Trendlines
Trendlines are essential for identifying and analyzing market trends:
Upward Trendline: Connects higher lows, indicating a bullish market.
Downward Trendline: Connects lower highs, signaling a bearish market.
By studying these patterns, traders can determine the market’s direction and pinpoint entry or exit opportunities.
5. The Cup with Handle Pattern
This bullish continuation pattern is a reliable indicator of future price movements:
The Cup: Represents a rounded bottom, signaling consolidation.
The Handle: Indicates a temporary pullback or consolidation following the cup.
When the price breaks above the handle’s resistance, it often triggers a significant upward move, making this pattern a valuable tool for traders seeking to capitalize on bullish trends.
Conclusion
Understanding these technical analysis concepts can significantly enhance your trading proficiency. When paired with the Profitoclock indicator, these insights become even more powerful, enabling you to navigate the markets confidently.
Take time to practice these principles and observe their application in real-market scenarios. Remember, mastery comes with learning and consistent application.
Empowering you with financial knowledge and insights.
Profitoclock is not a SEBI registered entity and the information provided on website is for educational and informational purposes only and should not be considered as investment advice or a recommendation to buy, sell, or hold any securities. All content on this website, including articles, courses, and other materials, represents the opinions of the authors and is not intended to provide personalized financial, investment, or legal advice.
Investing in the stock market involves risk, including the loss of principal. Past performance is not indicative of future results. Before making any investment decisions, you should conduct your own research or consult with a licensed financial advisor or legal advisor. Profitoclock does not guarantee the accuracy, completeness, or timeliness of the information provided on this website. We are not liable for any losses or damages, direct or indirect, arising from the use of or reliance on the information provided.
By using this website, you acknowledge that you are solely responsible for your own investment decisions and agree to hold Profitoclock and its representatives harmless from any claims or damages resulting from your reliance on the content of this website.
Disclaimer
Contact Us